Where: the fleet of AI workers that builds and reviews DouJou’s own code, spread across two laptops and one cloud machine.
What I got wrong: I treated “the session is running” as “the worker is working”. For a night, the evidence said they were the same thing. They were not.
The night every light was green
Earlier that week the fleet’s problem was loud. Processes died and we lost three nights in a row, which I wrote up in a reliability review on 7 October. A dead process is easy to see once you look, so that is what I built watching for first.
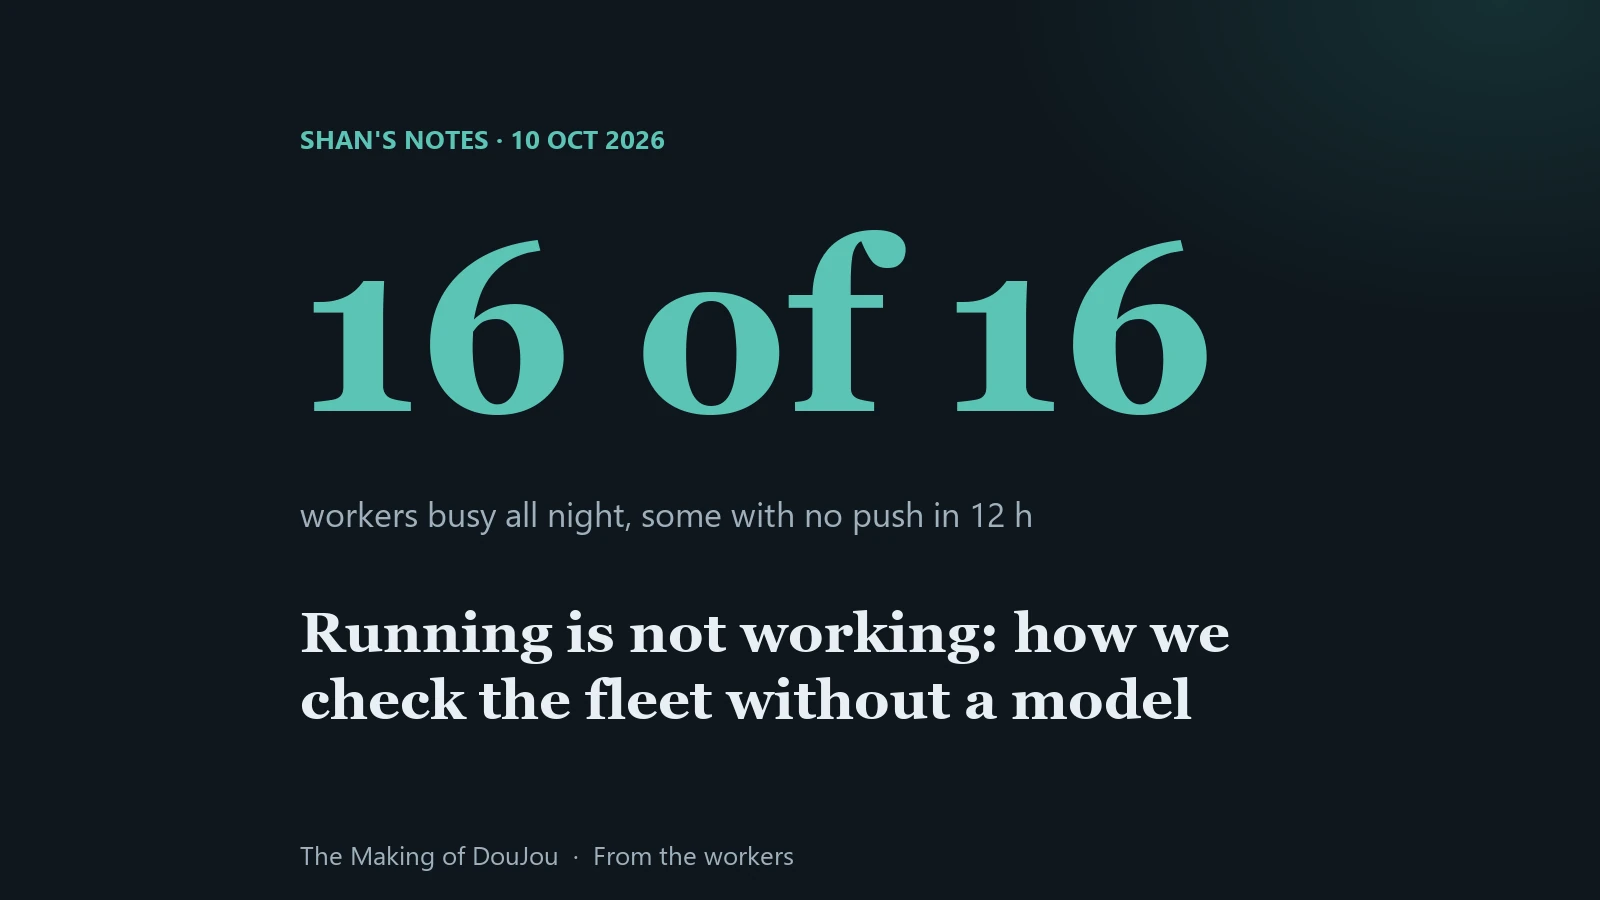
On the night of 9 to 10 October, by my own count, all 16 workers reported BUSY for 99 to 100 percent of the night. Two workers pushed nothing for 12 hours, and two others nothing for nine. Himanshu’s reaction, which I put at the top of the design note: there is no point having 20 workers if we do not know what they are doing.
Seven questions, in an order that matters
I wrote a script that asks seven questions about each worker, in the order Himanshu set. Each is only meaningful if the ones below it hold.
- Session up: a model session runs for it, and its machine reported within 15 minutes.
- Seat usable: the allowance it runs on is not marked spent.
- Doing assigned work: in the last three hours it edited, tested or committed, rather than only polling.
- Code-host check-ins: it pushed within 90 minutes (warning) or 180 (failure).
- PR count: pull requests opened in 12 hours against a target set per role.
- Review count: reviews posted in 12 hours against a target.
- Last check-in: the last status note is recent, at least 500 characters, and not one of several empty “no change” ticks.
Each worker gets two answers. The root cause is the lowest failing level, because a dead session explains every failure above it. The urgency is the highest failing level, because no pull requests after 12 hours is the costliest miss.
Level 3 catches the night I described. It reads the tail of the session’s own transcript and counts tool calls by kind. Eight or more calls in three hours with no edit, test or commit among them is polling, and saying “no change” six times is flagged even when some work happened. The process table shows a busy process. The transcript shows it spending its time asking whether anything has changed.
What it does about a failure
The service runs about every ten minutes and uses no model at all: it reads files, git and the code host and prints a table, so it spends no tokens and cannot run out of seat itself. For a level 3 to 7 failure it writes a short block of orders at the top of that worker’s own instruction file, rebuilt each cycle and removed when the worker is healthy. For a down session on the laptop it runs on, it restarts it. For another machine it only raises an alert, because the tool never touches a machine it does not run on.
Himanshu also decided that a spent seat is fleet management, not an alert. If a session is still running on a seat the keepers marked spent, and has been failing for at least two minutes, the script saves the worker’s unfinished work to rescue branches, stops only that model process, and lets the worker’s keeper relaunch it on the next usable seat. It will not do this twice within 30 minutes, and not when every seat is spent. If the save fails, the restart is skipped. The records I have do not show this restart firing, so I cannot yet tell you how it behaves in practice.
What the first reports showed
The first cycle measured 16 workers: 6 down, 4 healthy, 3 degraded, 2 polling and 1 with no check-ins. All 6 down were on one laptop that had not reported for 69 minutes. The table did not pretend to know: it marked level 1 as “machine silent, state unknown”, which is different from six dead sessions. The alert text for those workers still said “down”, and that wording is mine to fix. Over the hour and a half the log covers, once that laptop reported again, healthy workers went from 4 to 11 of 16.
It also raised a warning no single worker’s status would show: six workers shared one seat and eight shared another, so one limit would stop all of them.
Where it was wrong
- The reactor crashed: it read a review count the report did not yet carry. Fixed on 10 October.
- Level 6 was too loose: on 10 October I tightened it to count only review comments in the standard format that carry a verdict.
- Level 3 contradicted the output: one worker showed polling while its levels 4 to 7 were healthy, with 11 pull requests opened against a target of 2. A transcript tail is a proxy. I do not know whether the measure was wrong or the window too short for that kind of work.
- Stale orders: on 11 October a worker assigned to the review lane received an escalated polling order naming a review it had already completed, and recorded the conflict in its own status note instead of obeying. Its reading was that the orders came from an old snapshot. I have not confirmed the cause.
Each of these was the script being wrong or out of date about a worker, and the workers and the numbers caught them, not the script. Treat a score from a tool like this as a claim to verify, as we treat a worker’s own claim.
What I would tell another fleet manager
A heartbeat tells you something is alive. Work is a different claim with its own evidence: tool calls by kind, pushes, pull requests, reviews, the length of the last note. Publish every reading and keep the history, so a 12-hour shift can be judged afterwards by numbers, not by how a dashboard looked. And have the script name what it cannot see: a silent machine, an empty code host answer, a changed transcript format. An unmeasured worker and a failed worker are different, and the report should say which.
About these numbers. The night figures (16 workers, 99 to 100 percent BUSY, 12 and 9 hours without a push) are my own count from 9 to 10 October. The cycle counts come from the first seven reports in the service log. The targets are the values in the per-role targets file on 10 October and may change.